Have you ever said hello to someone who looked familiar, but then realized that they are a complete stranger? It’s embarrassing, sure. But the cost of mistaking someone for another person is much greater if you made this error as an eyewitness to a crime. This type of error is made when an eyewitness identifies an innocent suspect as the perpetrator. Unfortunately, it’s a common error among the DNA exoneration cases (e.g., made in over 71% of the cases of the ~375 wrongfully convicted individuals in the United States).
In a standard lab-based eyewitness experiment, participants take on the role of an eyewitness often by watching a video of a mock crime and are tested on their memory on a lineup. The lineup consists of photos of the innocent or guilty suspect and several fillers. Participants then make an identification or reject the lineup.
When participants identify the suspect with a high rating of confidence (e.g., 100%), the probability that the identified suspect is guilty is very high (~97%). And when participants identify the suspect with a low rating of confidence (e.g., 20%), the suspect identification is much more likely to be inaccurate (~20%).
Signal detection models of lineup data
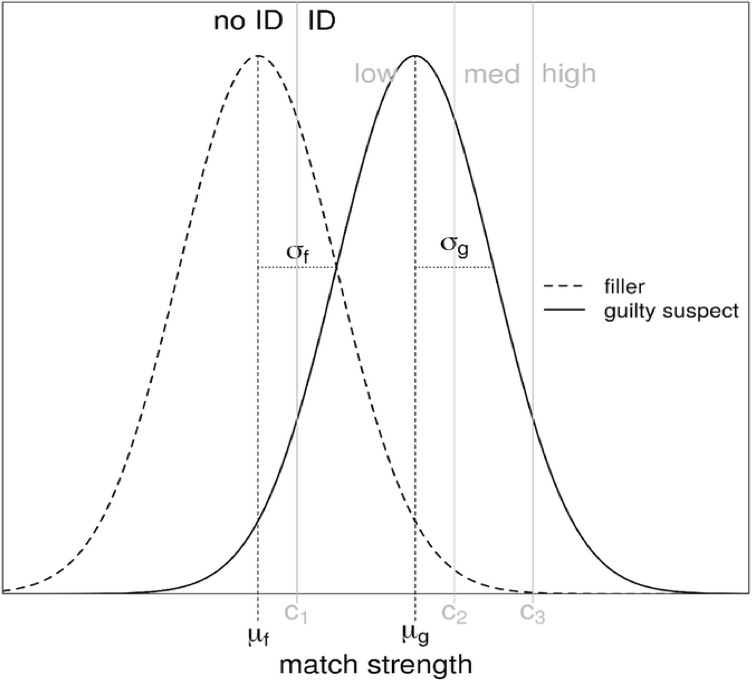
This pattern of responses can be easily accommodated by signal-detection theory. Consider the signal-detection model shown below.
A face in a lineup that generates a very strong signal is needed to make an identification with high confidence. As shown in the figure, fewer suspects, innocent and guilty, would generate a strong enough signal to surpass this criterion (c3). Many more suspects, innocent and guilty, would generate a strong enough signal to surpass the low confidence criteria (c1). This model and variants of it have been used to design better lineups, to better understand the confidence-accuracy relationship, and to better understand how eyewitnesses make identification decisions.
Base rates: How often do guilty suspects appear in lineups?
In most eyewitness memory experiments the base rates are 50% where half of the lineups include the guilty suspect and half include the innocent suspect. However, outside of the lab, in the real world, the base rate is unknown. And it likely varies considerably across jurisdictions.
A low base rate, where few guilty suspects are in lineups, reduces the opportunity to identify guilty suspects, and increases the opportunity to identify innocent suspects. Having an accurate estimate of the base rate is therefore important when considering the reliability of a suspect identification.
Researchers have recently used a signal detection model to estimate the base rate of guilt. They first fit the basic signal-detection model to laboratory data where the base rate was known to be 50%. To mimic the real-world scenario, those data were collapsed across so that the model did not know which lineups contained the innocent suspect or guilty suspect. The model was only privy to the number of
- suspect identifications made with low, medium, and high confidence
- filler identifications made with low, medium, and high confidence
- lineup rejections
The model correctly determined that the guilty suspect was present in 50% of the lineups. In other words, it recovered the base rate. The researchers then fit the same model to real-world data collected by the Houston Police Department involving eyewitnesses to real crimes. The model estimated that 35% of those lineups contained the guilty suspect. Moreover, eyewitness identifications that were made with a high rating of confidence were estimated to be very accurate (~97%). These findings are consistent with laboratory research showing that high confidence suspect identifications are highly accurate.
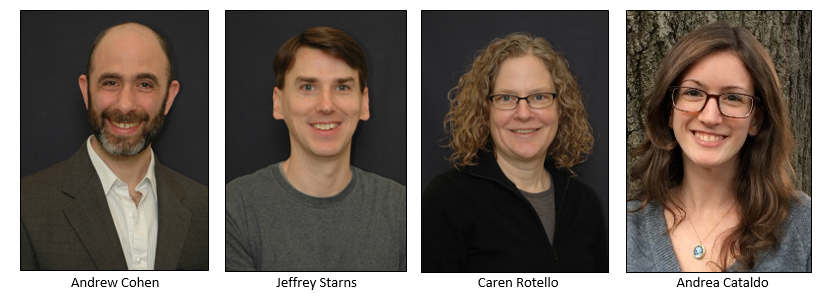
Cohen, Starns, Rotello, and Cataldo (pictured below) tested the ability of the model to recover base rates on a wider range of data in a recent paper published in the Psychonomic Society’s journal Cognitive Research: Principles and Implications. This article won the Psychonomic Society 2020 Best Article Award.
They first fit the model to a pooled collection of data from 13 eyewitness memory experiments, totaling 10,137 identification decisions. Each of these experiments included a six-person, simultaneous photo lineup, and confidence ratings were collected for each decision. Aside from that, the experiments differed in many other ways (e.g., different mock crimes), which provides a closer analog to real-world data than the data from any one experiment could provide.
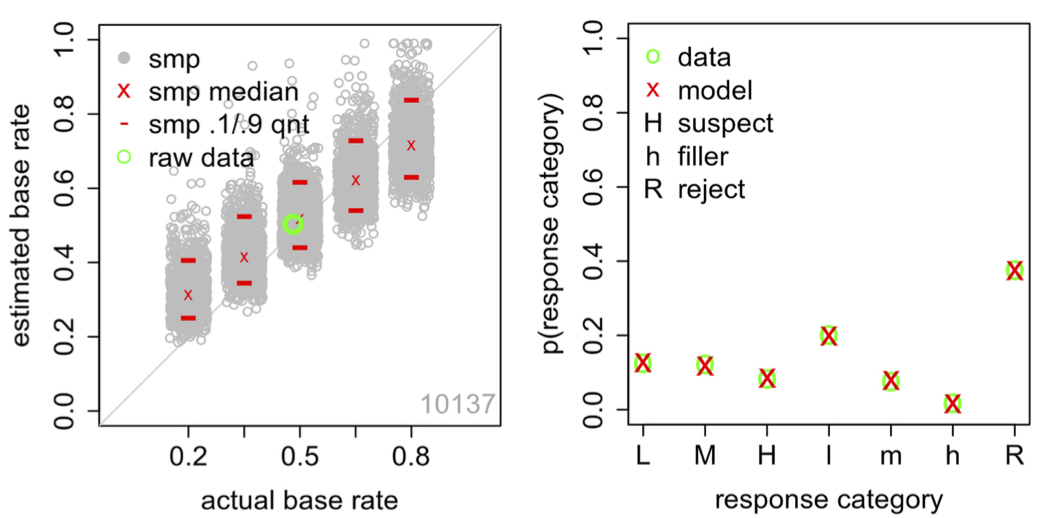
The results are shown in the figure below. In the left panel, on the y-axis is the estimated base rate and on the x-axis is the actual base rate. The green circle is the base rate for the pooled data, which is about 50%. The model successfully recovered the base rate.
Cohen and colleagues then explored whether this technique is viable when the model is fit to data where the base rate varies from the conventional 50%. To do this, they bootstrapped samples from the original data set to generate 5,000 different data sets. The data sets were generated so that the true base rate was 20%, 35%, 50%, 65%, or 80%. The model was then fit to each data set. The estimated base rates recovered from these model fits are shown as grey circles in the left panel. The red x’s indicate the median estimated base rate and the red lines represent 10th and 90th quantiles. Consistent with previous research, the model could recover the true base rate, especially when the true base rate equaled 50%. However, the model slightly overestimated the true base rate when it was low (e.g., 20%) and slightly underestimated the true base rate when it was high (e.g., 80%).
The panel on the right shows the model’s ability to estimate the proportion of suspect identifications, filler identifications, and lineup rejections. The green circles reflect the observed data and the red x’s reflect the model’s estimate. The proportion of suspect and filler identifications are separated by confidence. The labels L, M, and H show the proportion of trials that resulted in a suspect identification with low, medium, and high confidence, respectively. The labels l, m, and h show the proportion of trials that resulted in a filler identification with low, medium, and high confidence, respectively. As shown in this plot, the model accurately estimated the proportion of each decision outcome.
What if the suspect stands out?
These results show that this signal-detection model can suitably estimate the base rate of actual police-constructed lineups. Another factor to consider is the fairness of the lineup. The model was tested on fair lineups in which the suspects did not stand out from the fillers. In actual police-constructed lineups, the suspect may, on occasion, stand out from the fillers. In these cases, eyewitnesses may be biased to identify the innocent suspect.
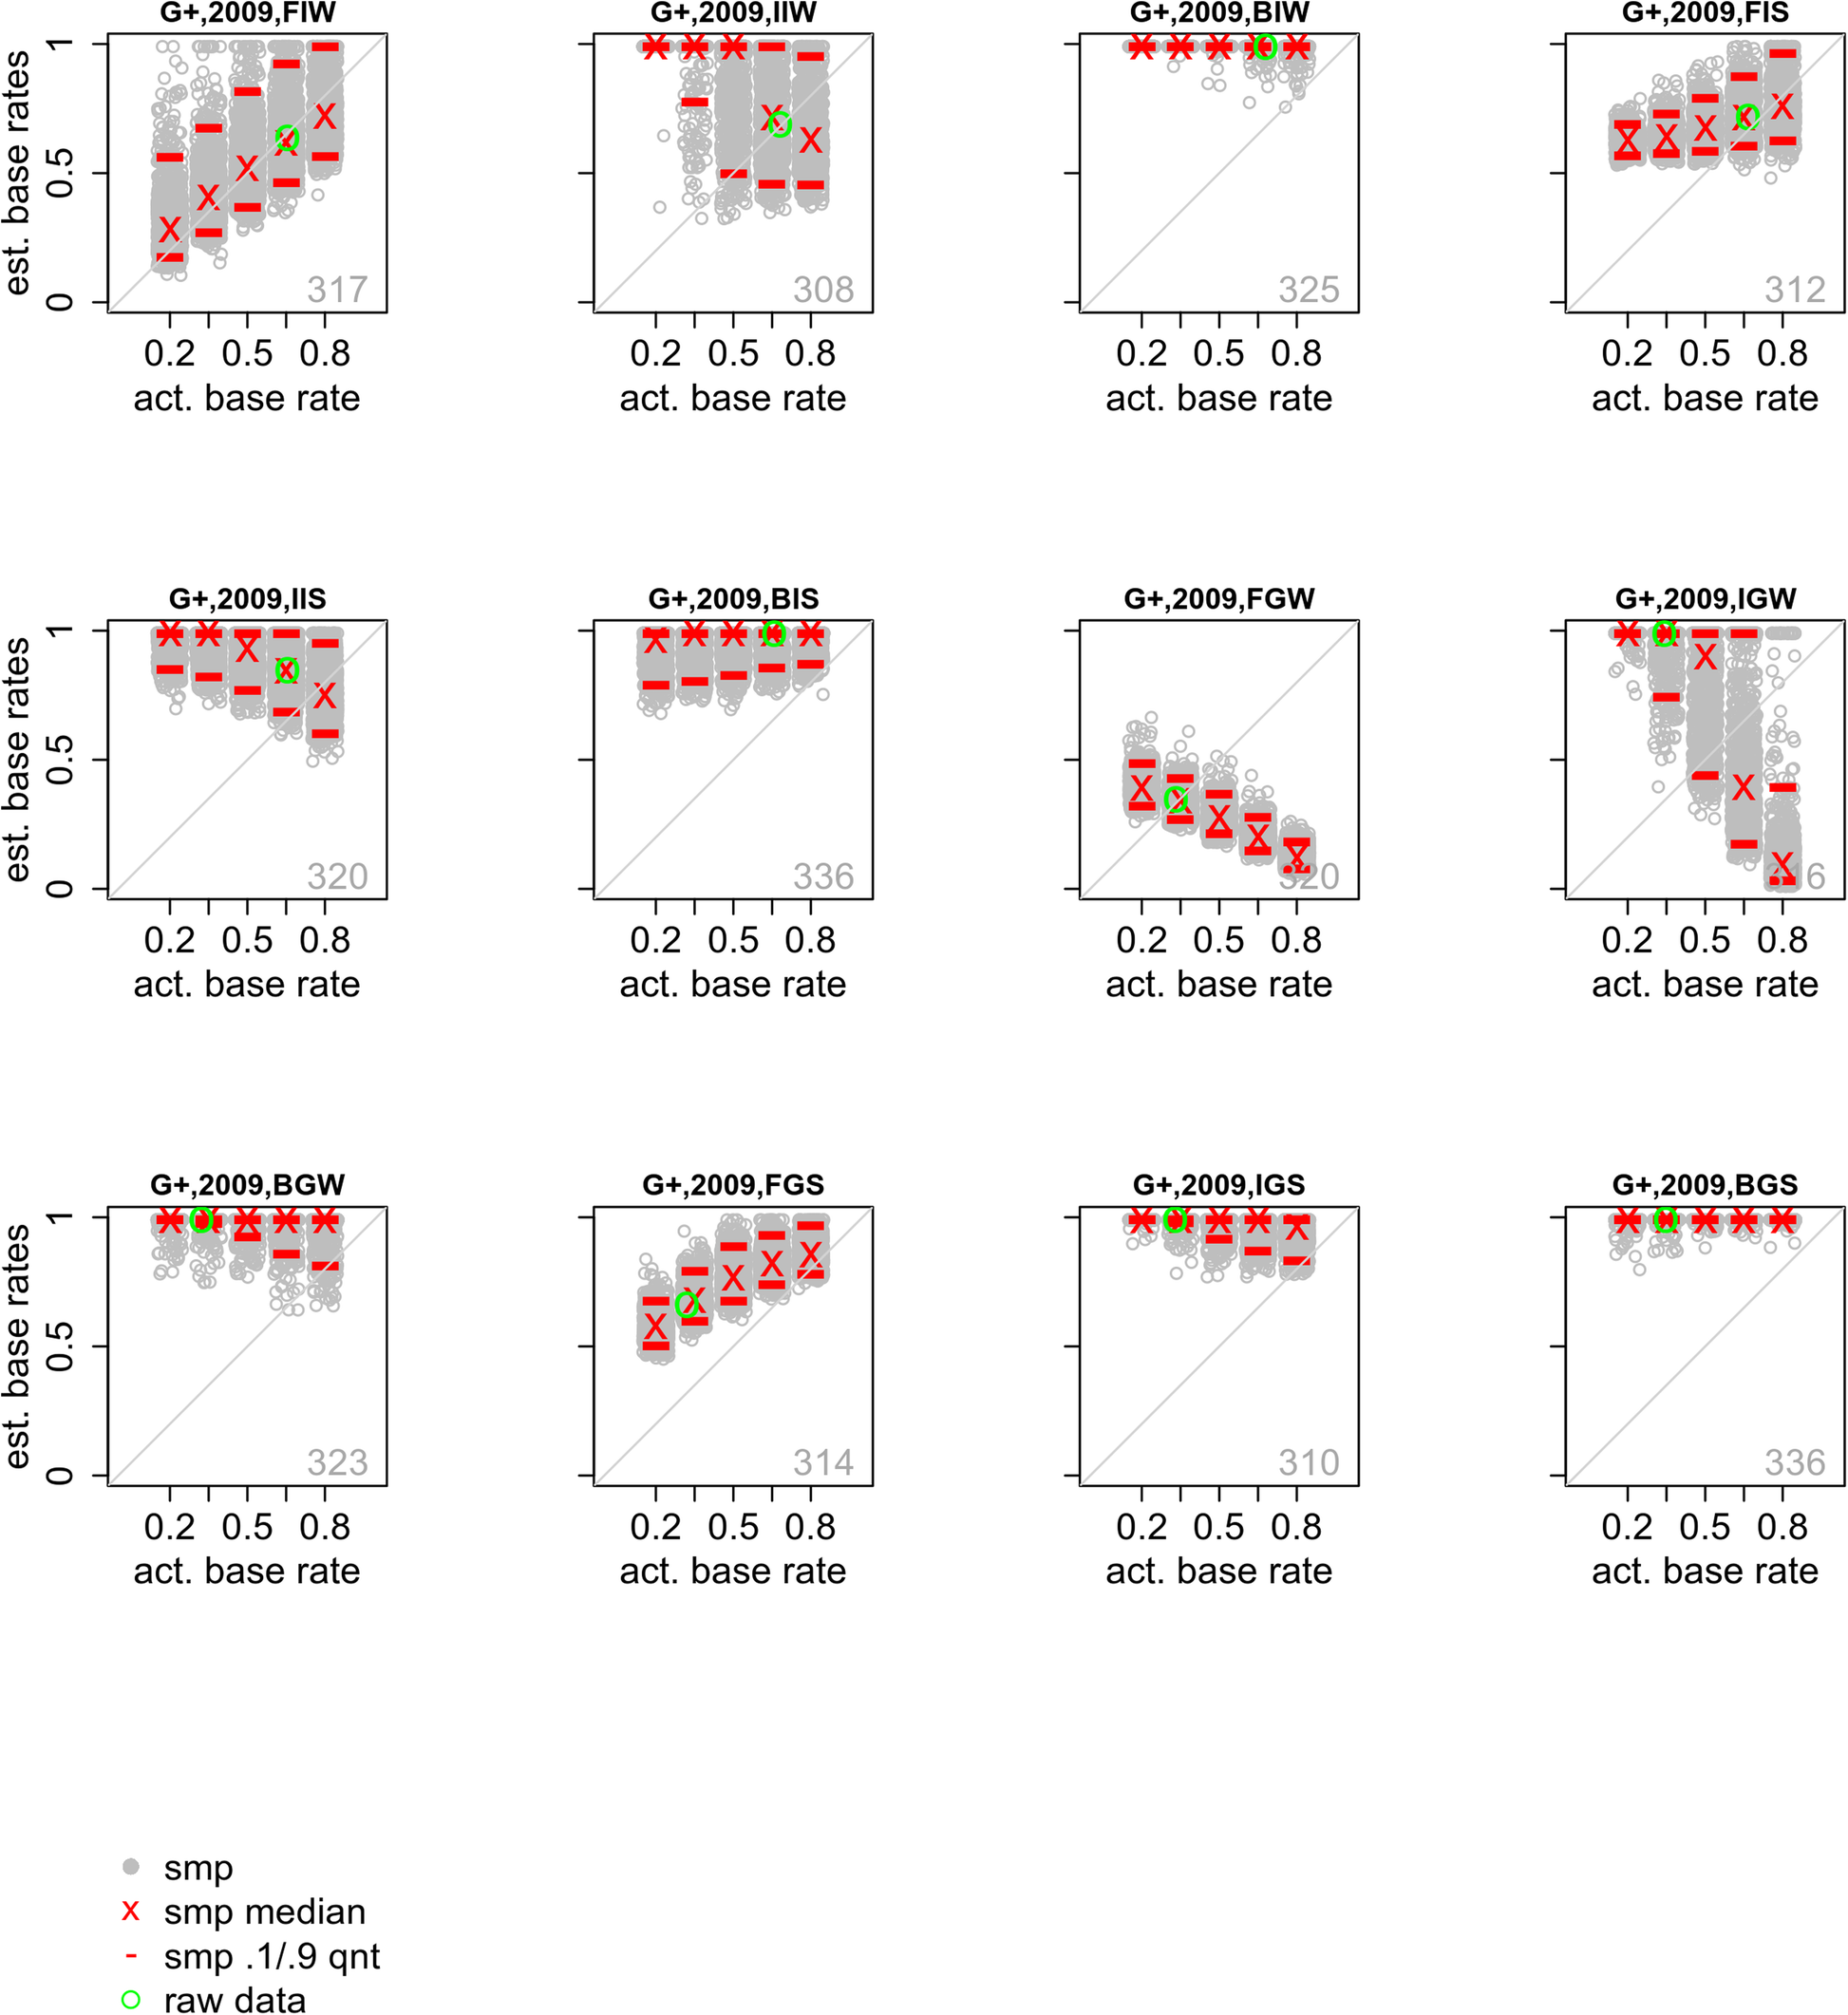
To test how the model performs when fit to unfair lineup data, Cohen and colleagues fit the model to several large datasets of fair or unfair lineup conditions. The results of these model fits are shown in the figure below. Generally speaking, there was a strong, positive correlation between the true base rate and the estimated base rate for the fair lineup conditions (FIW, FIS, FGW, and FGS are the fair lineups). The model was able to accurately estimate the true base rate for these conditions as illustrated by the green and grey circles in these panels. There was a different pattern for the unfair lineup conditions (BIW, BIS, BGW, and BGS are the unfair lineups). For these fits, the model could not estimate the true base rate.
Using fair lineups is a good policy for many reasons and this research highlights another one. If police departments routinely conduct unfair lineups, then this signal-detection model will likely be unable to accurately estimate the true base rate. However, if police conduct fair lineups, then this model can accurately estimate the true base rate, especially if the true base rate is close to 50%. Knowing the true base rate helps judges, jurors, lawyers, investigators, etc., assess the reliability of a suspect identification. This model provides a critical and valuable piece of information to the criminal justice system.
Psychonomic Society article covered in this post:
Cohen, A. L., Starns, J. J., Rotello, C. M., Cataldo, A. M. (2020). Estimating the proportion of guilty suspects and posterior probability of guilt in lineups using signal-detection models. Cogn. Research 5, 21 (2020). https://doi.org/10.1186/s41235-020-00219-4


