Meet Amy, Rich, and George. They are participants in your study on the detectability of an English pea among a set of sugar snap pea distractors. All participants work diligently and quickly and yield the following results: Amy responds within 422 milliseconds on average, with an accuracy of around 88%. Rich is a little slower at 467 milliseconds, but is also more accurate at 95%. George is slowest at 517 milliseconds but matches Rich’s accuracy of 95%.
How does their performance compare? Who wins the English pea detection competition?
This question is not always easy to answer. Consider first Rich and George: they both score the same accuracy but Rich is much quicker. It may therefore be legitimate to declare that Rich beats George. But what about Rich and Amy? This comparison is much trickier to resolve because even though Amy is a little less accurate than Rich (88% vs. 95%), she is also 45 milliseconds quicker (422 vs. 467). So if speed is important, Amy is the winner, but if accuracy counts more than speed, then Rich should get the English pea detection prize.
The case of our three participants presents the classic speed-accuracy trade-off dilemma in psychological experiments. And this is no isolated case: As one researcher has noted, “There are few behavioral effects as ubiquitous as the speed-accuracy tradeoff (SAT). From insects to rodents to primates, the tendency for decision speed to covary with decision accuracy seems an inescapable property of choice behavior.”
Except sometimes the two variables trade off in unpredictable ways. Participants can change their SAT from trial to trial and at will, and sometimes people will systematically shift their SAT in response to a behavioral intervention.
Sometimes the observed SAT itself is the phenomenon of interest—for example, the “post-error slowing” that is often observed in a sequence of trials after people commit an erroneous response. In many other situations, however, the SAT is a nuisance: if I want to know whether my nootropic supplement really boosts academic performance, then my experiment would be difficult to interpret if the supplement group was somewhat faster but a little less accurate than a placebo control group. This dilemma cannot be resolved by deciding a priori that accuracy is all that matters—after all, the fast participants in the experimental group might have done much better if they hadn’t rushed so much, and hence my accuracy conclusions might be compromised.
What we need, therefore, is a meaningful way in which we can consider accuracy and response time together.
Several solutions have been offered in the literature, and a recent article in the Psychonomic Society’s journal Behavior Research Methods reported a comparative evaluation of different ways in which accuracy and speed can be considered together.
Researchers Heinrich René Liesefeld and Markus Janczyk conducted their evaluation using synthetic data that were generated by a model with known parameter settings. Those synthetic data were then analyzed by 4 different candidate measures that combine response time and accuracy. Because the true effect in the data was known, Liesefeld and Janczyk were able to adjudicate between the 4 candidate measures.
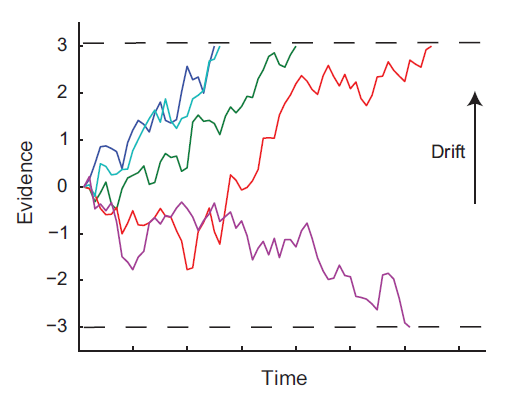
Let us first examine how the synthetic data were generated. Liesefeld and Janczyk used the drift-diffusion model, which we have presented here before. Briefly, in the drift-diffusion model, people are assumed to sample information from a stimulus over time. Those successive samples are added together, and on the further assumption that evidence for one decision (e.g., “there is an English pea present”) has a different sign from the evidence for the opposite decision (“all sugar snap peas”; we are ignoring some nuance about the decision here), we can graphically display the decision process as a “drift” towards the top or the bottom of a two-dimensional space with time on the X axis and evidence on the Y axis.
The figure below shows a few hypothetical evidence-accumulation trials from the diffusion model.

The horizontal dashed lines at the top and bottom represent decision thresholds for the two responses (e.g., top = English pea vs. bottom = sugar snap peas). Whenever a diffusion path crosses a threshold, a response is made and the time taken to reach it is recorded.
In the above figure, most responses go to the top because the figure illustrates a situation in which there is a signal present (i.e., an English pea), and hence there is a positive “drift” overall. However, because the evidence is noisy, on occasion an error is committed and the signal is missed—as with the purple diffusion path above.
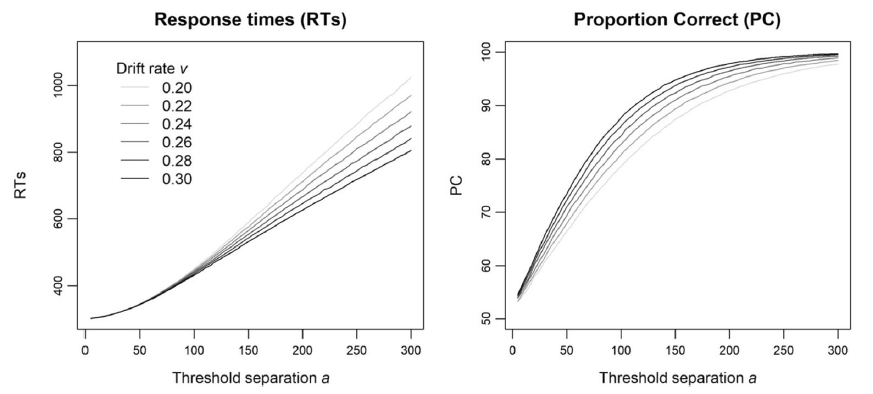
A crucial property of the model is that as you move the decision thresholds further apart, response times will increase (since it takes longer to reach a threshold) but the likelihood of correct responses will increase as well (because it is harder to cross the wrong threshold by accident if it is further away). The next figure shows the effect of increasing threshold separation on response times and accuracy in the synthetic data:

In each panel, there are multiple lines that represent different drift rates, that is different strengths of the signal. The higher the drift rate, the greater the accuracy and the faster the responses, all other things being equal. Comparison of the panels for a given drift rate reveals the effects of a pure shift along the SAT continuum: As threshold separation varies, the model trades accuracy for speed and that trade-off is not contaminated by any “real” effect.
Liesefeld and Janczyk were thus able to generate synthetic data that, on the one hand, captured a pure SAT uncontaminated by any “real” effect (by manipulating threshold separation while keeping drift rate constant), but on the other hand also reflected a “real” effect (by changing drift rate while keeping thresholds constant).
The question of interest, then, is how the various candidate measures to integrate accuracy and response times respond to the underlying true structure in the data. Ideally, they should be sensitive only to real effects (i.e., drift rate) but not to SAT (i.e., threshold separation).
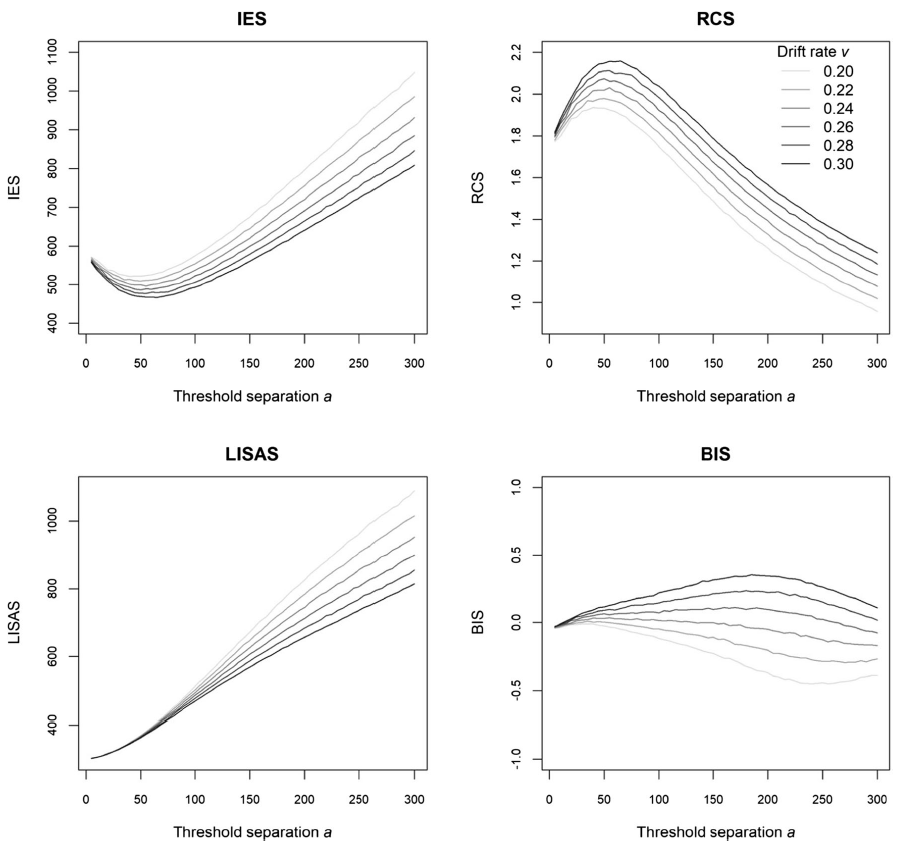
The figure below provides a glimpse at the results. Each panel represents one candidate measure (explained later), and in each panel ideally the lines should be far apart from each other (representing sensitivity to the real effects captured by drift rate), and they should be flat (representing no sensitivity to the pure SAT captured by threshold separation).

It is quite clear that all candidates are sensitive to real effects. However, all but one of the candidates were also very sensitive to the very SAT that they were designed to correct for! There is only one measure that ignores a pure SAT while still capturing real effects, namely the BIS in the bottom right.
The winner is the Balanced Integration Score (BIS).
The BIS is trivially easy to compute: It is calculated by first standardizing each measure (response times and accuracy) into z-scores to bring them onto the same scale, and then subtract one standardized score from the other. Or, more formally: BIS = z(PC) – z(RT), where PC stands for proportion correct and RT for response times, and where the z scores are formed across all observations.
Liesefeld and Janczyk cite several reasons for combining accuracy and response times into a single measure: first, using BIS cancels SATs to a large degree, thus guarding against the detection of “effects” that are not real but represent participants’ shift between different accuracy regimes. Second, combining two measures into a single statistical test avoids inflation of Type I error rates that would occur when the two are tested separately. Third, if participants differ with respect to SAT, then the effects of experimental variables might be distributed across accuracy and speed, and separate analyses of each measure may lack statistical power to detect an effect.
By the way, it is Rich who wins the English pea prize based on the BIS. But Amy still beats George.
Psychonomics article highlighted in this post:
Liesefeld, H. R., & Janczyk, M. (2019). Combining speed and accuracy to control for speed-accuracy trade-offs (?). Behavior Research Methods, 51, 40-60. DOI: 10.3758/s13428-018-1076-x.
