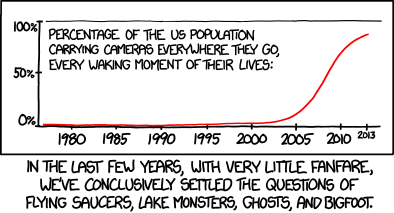
One of my favorite xkcd comics is Settled. See below.
It’s a cool example of statistical inference. Evidence accumulates for a null hypothesis without any new data coming in. The only thing that changes over time is the expectation under the counterfactual: if Bigfoot were real, the ubiquity of cell phone cameras means that we should be seeing more pictures of it now than we did 20 years ago. I thought I’d introduce today’s post with a slightly more elaborate version of this argument.

Bigfoot
The relatively sudden penetration of camera phones in the population is a bit like a massive-scale natural intervention study: for a long time there were no camera phones, then they were introduced globally, and now we can measure the naturally occurring change in the frequency of Bigfoot photographs. (Of course, as a study it is poorly controlled. Time is a confounder since Bigfoot might have died or wizened up to our cameras. Also, I don’t have any systematic data on the frequency of Bigfoot photos so I took the first thing that Google suggested. Please don’t take these toy results too seriously.)
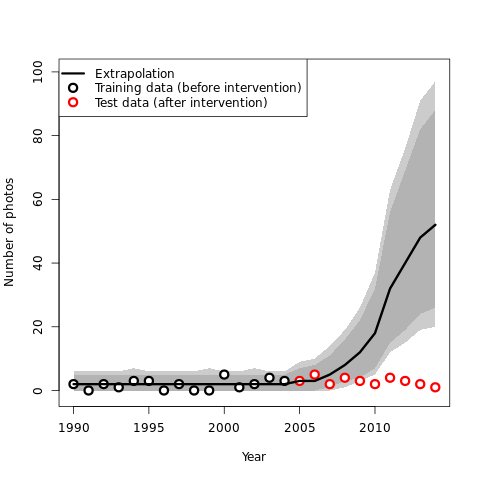
To measure the effect of an intervention, we can fit a model to the pre-intervention observations, extrapolate to the post-intervention period, and compare the prediction to the observed data. For example, using a fairly simple model (code) in which the number of Bigfoot photos Ny in year y is determined by the constant probability E of encountering it times the probability Cy of having a camera handy, I am able to generate predictions using a Poisson model: Ny ~ Poisson(E × Cy). For the following graph, I fit the model to the 15 years before camera phones (the “training data”) and extrapolated to the 10 years after camera phones (the “test data”):

Clearly, this model and its predictions need a big reality check. Out of ten out-of-sample data points, fewer than half fall within the 99% cone of uncertainty. The probability of the test data under this model is on the order of 10^-87. (That’s a small number with too many 000000 after the decimal point to print.)
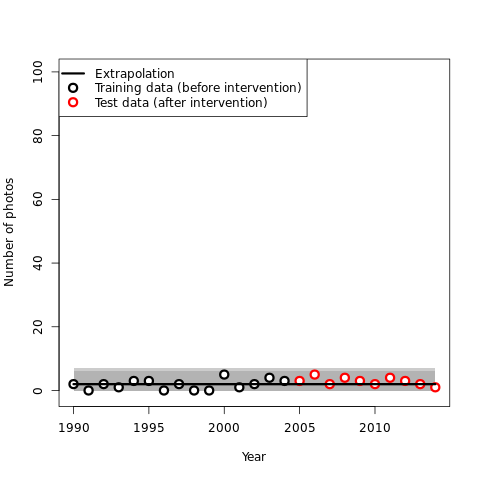
What do we get from a model in which the frequency of Bigfoot photos does not react to the availability of cameras?

This model performs much better! All of the observations fall within the prediction bounds, and the probability of the data is an agreeable 68 orders of magnitude greater under this model than under the previous one. I can’t confidently say the second model is right in any absolute sense, but I’m now fairly sure the first model is up for improvement!
Comparing these two competing models―one in which the availability of cameras influences the number of Bigfoot snaps and one in which it does not―is relatively easy: We can compare their relative predictive success (as above), or we could compute how big the total prediction error is under either model and compare those two values.
Local methods and resampling techniques
However, this toy example is a bit of a special case. We are comparing two well-specified mathematical models for which the data are nicely structured in time. For more general cases, we must look to more general methods.
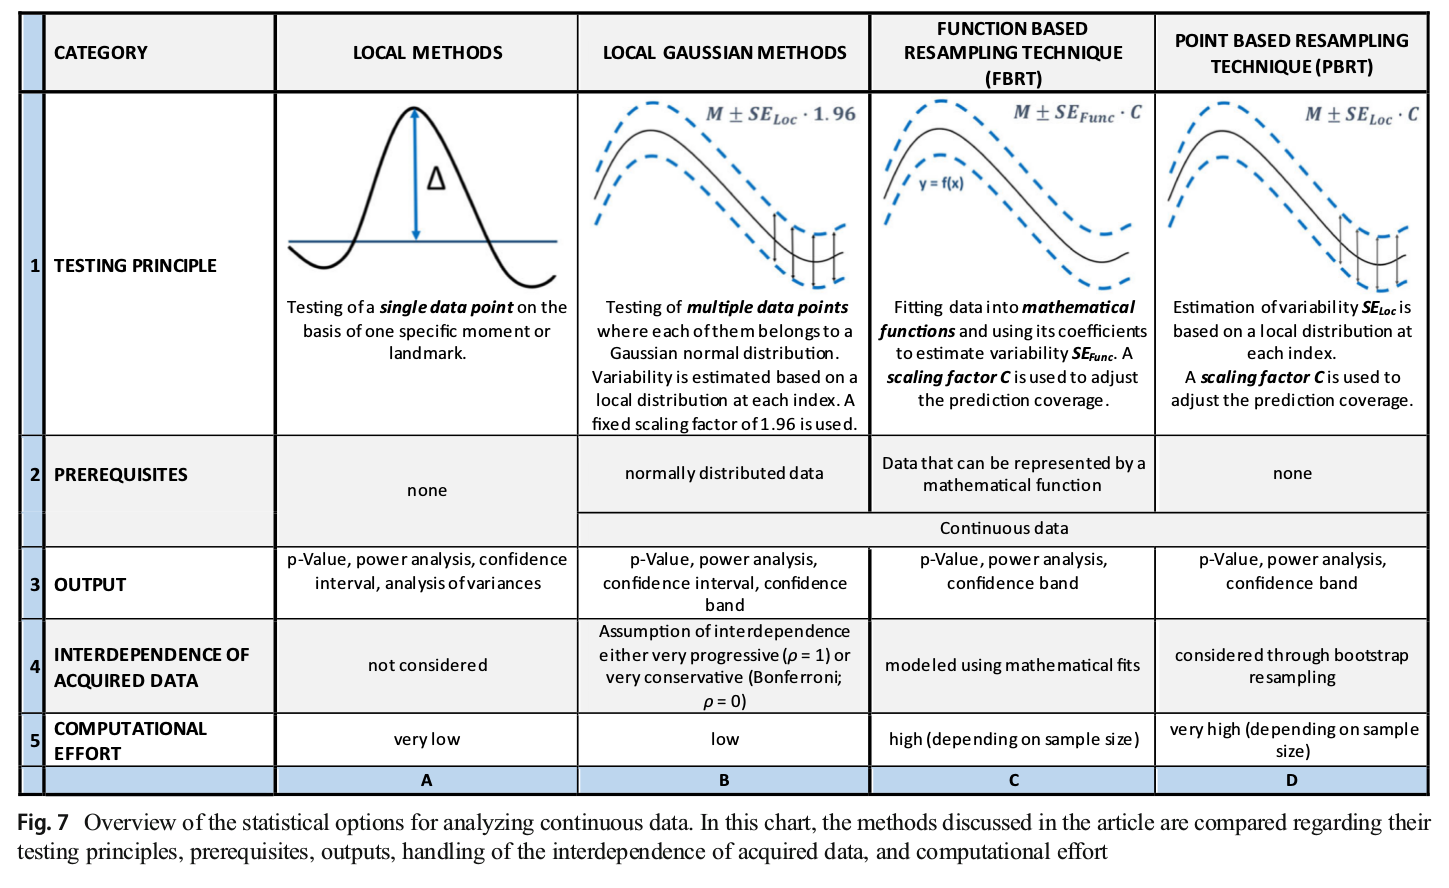
Enter Michael Joch, Falko Raoul Döhring, Lisa Katharina Maurer, and Hermann Müller. In their recent article in the Psychonomic Society’s journal Behavior Research Methods, they compare three techniques that deal with continuous data (i.e., data whose observations can occur at any time) and introduce a fourth technique that is widely applicable.
Two of the existing techniques are known as local methods. A local method is one in which a particular point on the horizontal axis (e.g., a specific time point) is singled out and used to represent the entire series for the purposes of statistical testing or model comparison. Such methods have obvious disadvantages. Specifically, it is not always possible to find a single data point that so well represents the entire multidimensional dependent variable that all other data points are redundant with respect to it―one example would be a dynamic process in which individual data points are less meaningful than patterns across time series such as autocorrelation, drift, and so on.
To avoid the weaknesses of local methods, continuous approximations can be used that allow inference about all points in a series simultaneously. Although all variables in the Bigfoot example are discrete, a continuous approximation is possible there―nothing in the model would change if the horizontal axis were made continuous. Rather than local, the method there was function-based.
The third method Joch and colleagues discuss is a nonparametric variation they call the function-based resampling technique. This method also has an obvious drawback: It requires us to be able to represent the time series with an adequate functional form. Of course, such a function might not be available.
To overcome these limitations, Joch et al. propose a new nonparametric method they call the point-based resampling technique (PBRT). This method uses point-by-point variance estimates and bootstrapping to calculate confidence limits around the training data. Those confidence limits are constructed and scaled in such a way that a single data point outside the confidence limits (at any point in the test data) implies a violation of the model. PBRT is computationally demanding, but has the significant advantage that it is applicable more generally than any other method. Specifically, it applies to time series data for which no good functional approximation exists (e.g., EEG). Joch and colleagues helpfully provide this overview of the methods they survey:

Discussion
Psychological science is regularly criticized for unlikely claims and low standards of evidence. When evidence is hard to come by―because it is elusive, or expensive―that often feels like an unfair, below-the-belt kind of critique.
Nature does not owe anyone any evidence. And Bigfoot is under no obligation to make an appearance.
However, the ability to collect and analyze highly multidimensional, complex human data provides behavioral scientists with an opportunity to make stronger statements that rest on more solid empirical foundations. High-dimensional data are often no more expensive to collect than low-dimensional data (e.g., it takes no more resources to collect choice response times than simple responses), and they can be a rich source of evidence for theory development and testing. Methods for dealing with multivariate data in principled and efficient ways are welcome additions to our statistical toolbox.
Psychonomics article featured in this post:
Joch, M., Döhring, F. R., Maurer, L. K., & Müller, H. (2019). Inference statistical analysis of continuous data based on confidence bands—Traditional and new approaches. Behavior Research Methods, 51, 1244-1257. DOI: 10.3758/s13428-018-1060-5.
