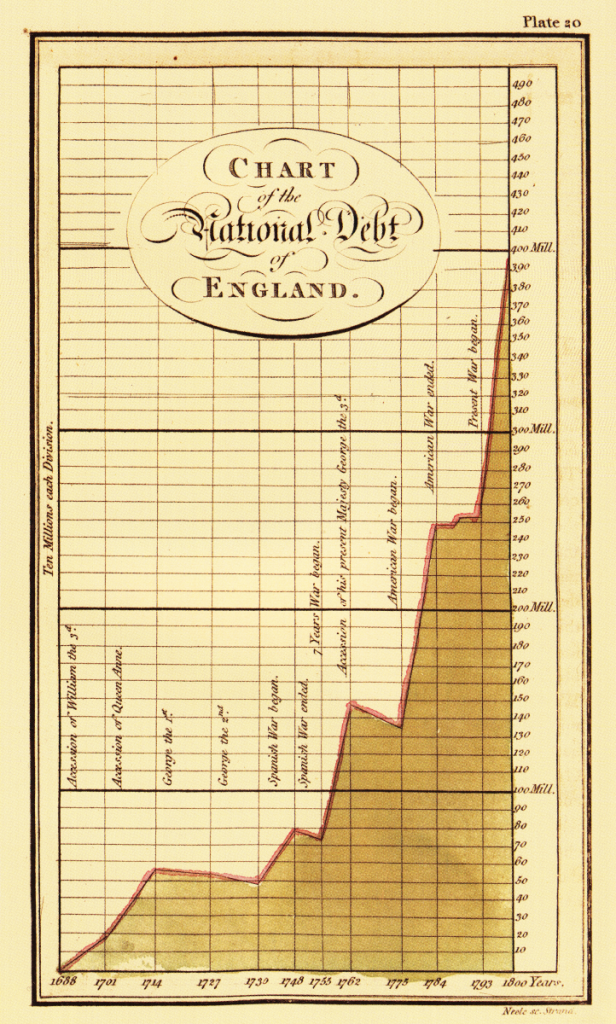
Statistical graphs are so ubiquitous and part of our daily work that we may forget how powerful they are. Since their invention by William Playfair a little over 200 years ago, graphs have become indispensable tools not just in science and business, but also in politics. Indeed, one of Playfair’s contributions was to draw attention to the alarming trend of the increase in England’s national debt between 1688 and 1800.

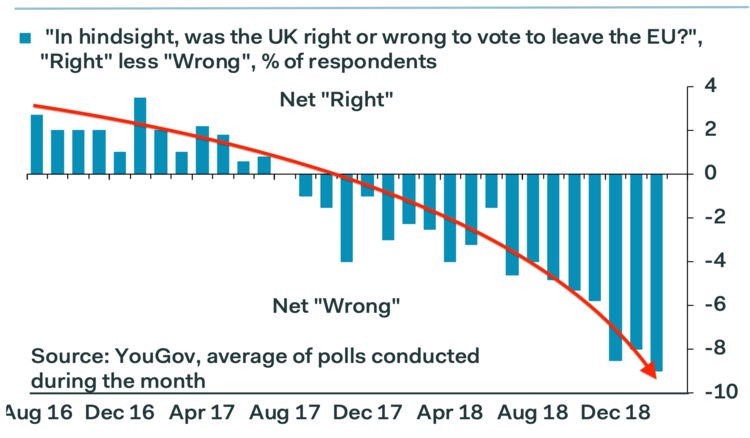
Politics has moved on from the 18th century and we now have a few other trend lines to contend with, although they are not always pointing up:

The power of graphs to tell a story should not be underestimated. We have noted earlier on this blog that at least one graph, the famous “hockey stick” of global temperatures during the last millennium visualizes the problem of global warming so well that it has been the source of much politically-motivated dismissal.
 Understanding how people process graphs is therefore an important cognitive challenge. A recent article in the Psychonomic Society’s journal Attention, Perception, & Performance examined one particular aspect of graph comprehension, namely the “proximity compatibility” between its elements that is posited to facilitate comprehension. In a nutshell, compatibility states that graphs are easier to read if graphical elements align in a compatible manner—for example, participants can read a graph more quickly if, say, the upper data line is black and the upper legend entry also refers to this black line, rather than the black line being explained elsewhere in the legend. Researchers Eva Riechelmann and Lynn Huestegge were interested in situations in which local compatibility is in conflict with global compatibility.
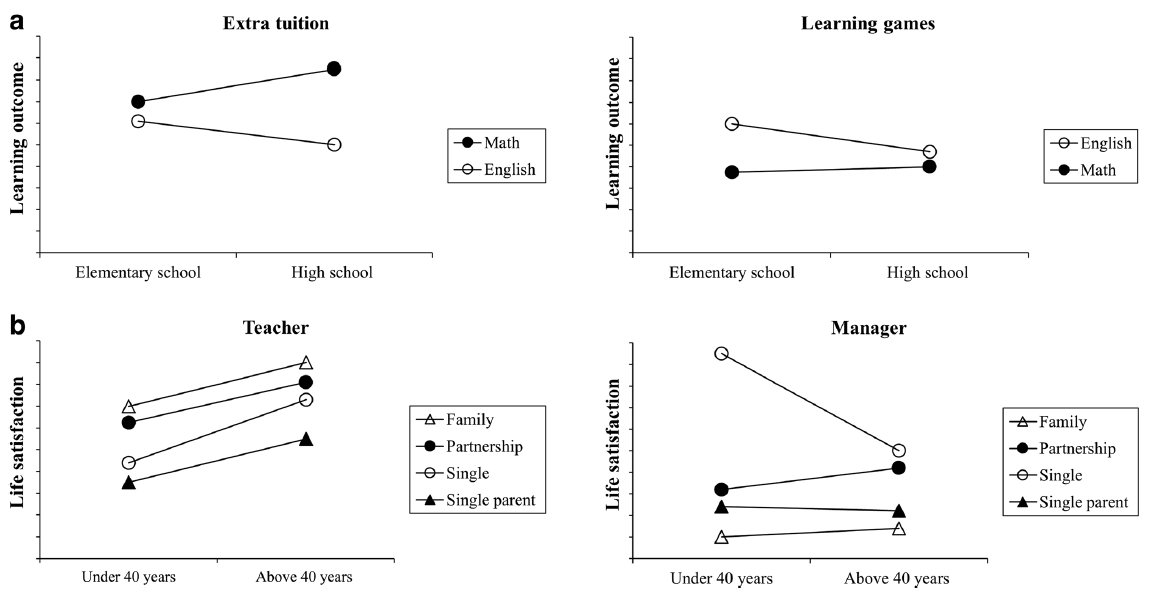
The figure below illustrates the two types of compatibility using arbitrary data. In the top row (a), the legend is locally compatible within each panel—that is, the order of data lines matches the order of legend entries. This is expected to facilitate reading of each panel in isolation. However, this local compatibility introduces a global conflict because the legends now differ between the two panels.

The bottom row (b), in contrast, sacrifices local compatibility in favor of global compatibility—that is, the legend in both panels is identical. It is unknown how local and global compatibility trade off in multi-panel figures.
Riechelmann and Huestegge presented participants with a series of multi-panel graphs and comprehension questions. For example, participants might see the two panels in the top row of the above figure, and might be asked: “For what kind of learning support is the learning outcome for the subject mathematics higher than that for the subject English?” The unambiguously correct answer would be “extra tuition”. In all cases, the correct answer involved one of the panels shown on that trial. Participants recorded their response by clicking on one of the panels, with response time and accuracy being measured.
Riechelmann and Huestegge reported two experiments; here, I focus on the second one. The researchers varied the compatibility of the graphical elements and the legends across trials: they were either entirely incompatible, locally compatible, or globally compatible. In the incompatible condition, neither between-legend compatibility nor any individual data–legend compatibility was present. In the global-compatibility condition, the legends were the same across panels but there was no consistent match between the order of legend entries and data lines within each panel. The converse was true for the locally-compatible condition.
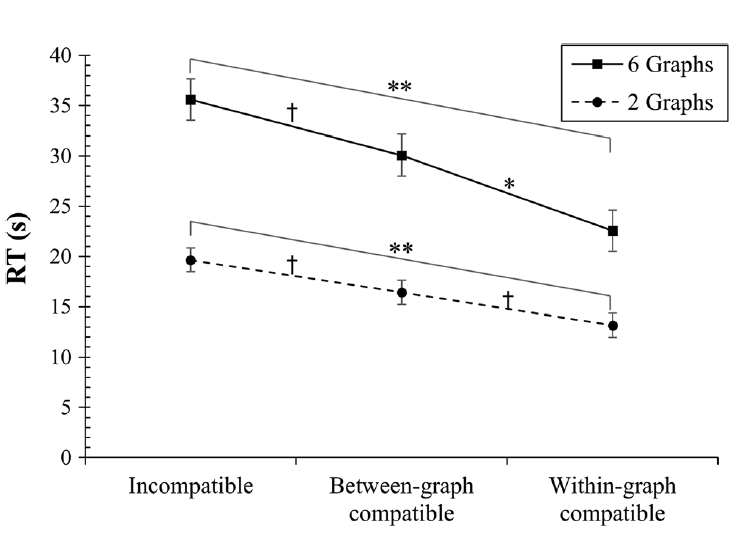
The researchers also varied the number of panels in the figures, with either 2 or 6 panels shown on each trial. This variable was manipulated orthogonally to compatibility. The main results are shown in the figure below.

As shown in the figure, there was a significant effect of compatibility on response times. Responding was slowest in the absence of any compatibility, and it was fasted when the legend was compatible within each panel (but differed between panels).
An intriguing implication of these results is that people do not seem to be slowed by the fact that legends differ from each other between panels: what matters most is that within each panel, the order of lines is compatible with the order of legend entries. Riechelmann and Huestegge suggest that:
“participants appear to follow a graph-by-graph decoding strategy that benefits from spatial data–legend compatibility within each single graph. Spatial data–legend compatibility could reduce the need for mental transformations and working memory load necessary to associate the data lines with their respective meanings coded in the legend.”
Although it is less apparent from just looking at the above figure, there was also a significant interaction between the number of panels and the compatibility variable. Compatibility had a larger effect when a larger number of panels was present. This results was not unexpected, given that previous research has shown that compatibility effects scale up with the complexity of the data being displayed.
Riechelmann and Huestegge offer a number of specific recommendations for the design of multi-panel graphs:
- Compatibility issues should be considered carefully during graph design.
- It should be compulsory to consider spatial data–legend compatibility within each panel.
- Global compatibility, by contrast, is of lower priority.
These principles are straightforward to implement. To illustrate, in MATLAB, legend entries are ordered in the order in which variables are being plotted. So all you need to do is to make sure to plot variables in the order in which they will appear in the graph—as is done in the example provided by MATLAB:

Psychonomic article highlighted in this post:
Riechelmann, E., & Huestegge, L. (2018). Spatial legend compatibility within versus between graphs in multiple graph comprehension. Attention, Perception, & Psychophysics, 80, 1011-1022. DOI: 10.3758/s13414-018-1484-0.
