We’ll start this one off with a trivia question (and perhaps a bad joke). What do astronomers and researchers who study eye movements have in common? For one, they both have a keen interest in orbits! The other thing they have in common? When describing eye movements, vision researchers use a term that’s actually borrowed from astronomy.
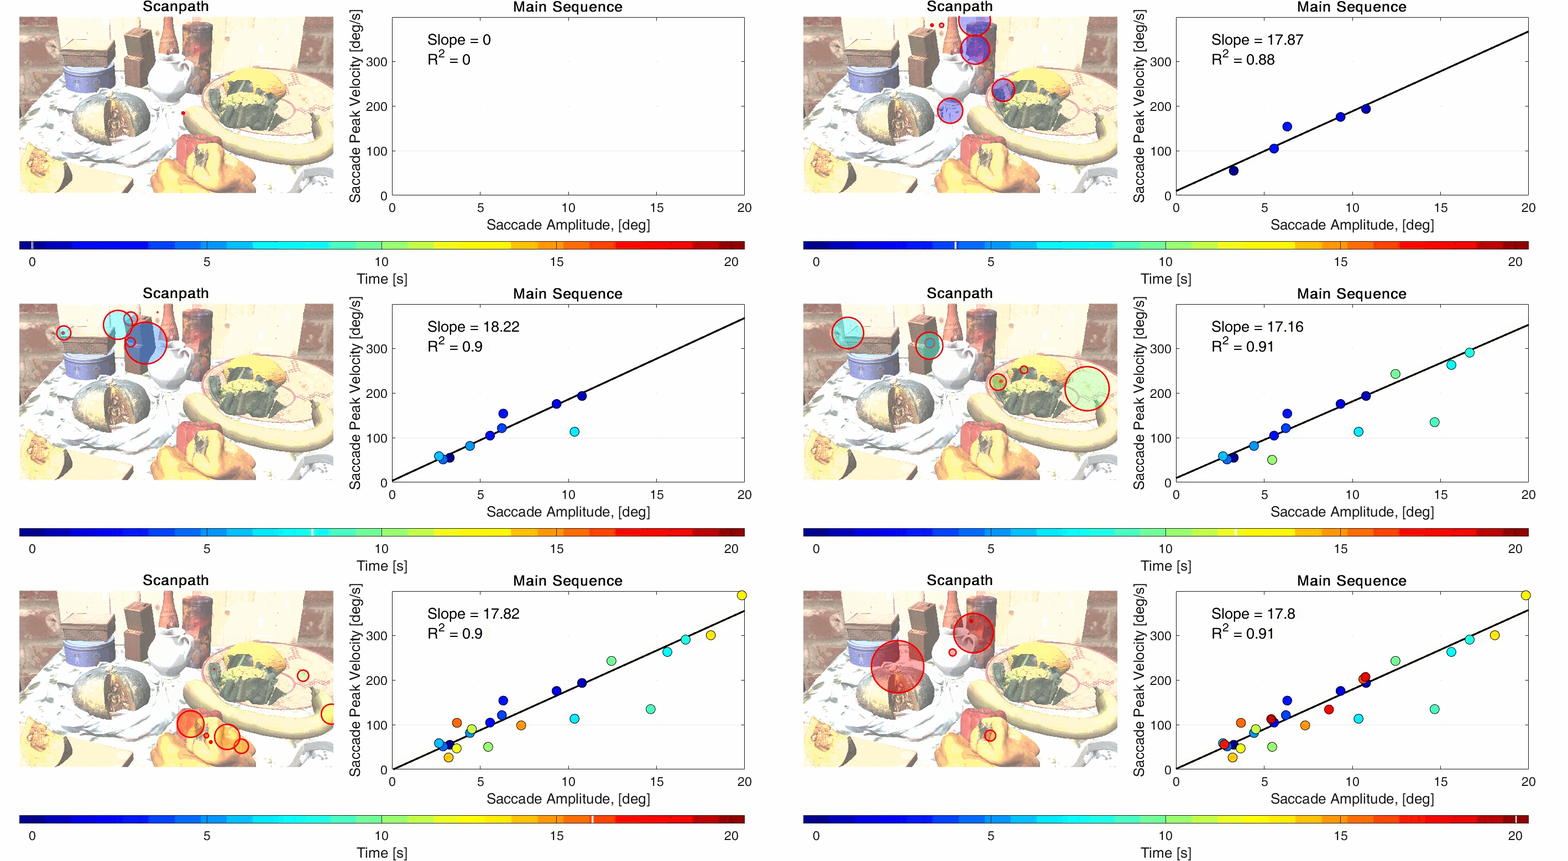
To explain this a bit more, whenever we move our eyes around to scan a scene – for example, looking at a table covered in food like the picture below – we make roughly two to four rapid eye movements per second, in between pauses known as fixations. These rapid eye movements, called saccades, have some pretty remarkable properties. Early on, researchers noticed that saccades follow a characteristic pattern. When you make a small saccade (for example, when you move your eyes from one bell pepper to another in the same bowl), it takes less time and your eyes move more slowly. When you make a large saccade (for example, from one end of the table to the other), it takes more time, and your eyes move faster.

As shown in the graph above, this is a very consistent and reliable relationship. The larger the size (or amplitude) of the saccade, the greater its duration and its maximum (peak) velocity. This relationship is called the ‘main sequence’, and the term is borrowed from astronomy, where it describes a characteristic relationship between the temperature and brightness of stars. In a paper published in Psychonomic Society journal, Behavior Research Methods, Agostino Gibaldi and Silvio Sabatini (pictured below), have developed a procedure – and released a publicly-available toolbox – to analyze eye movement data to allow for consistent measurement of the saccade main sequence.
Why is the main sequence so important? Aside from giving us a beautiful graph, the main sequence is critical for understanding how eye movements vary between different populations, and it can be a useful diagnostic tool in clinical studies. To put it simply, if we see a departure from this pattern, it can indicate some impairment or difference in oculomotor performance from healthy controls. In fact, the main sequence has been used to evaluate eye movements in a number of clinical populations, including patients with myasthenia gravis, multiple sclerosis, and Parkinson’s disease. Measuring the main sequence has many other research applications, from evaluating the quality of eye tracking data, to studying cognitive functions such as decision-making, and even measuring the effects of certain drugs on eye movement behavior.
However, a challenge in measuring the main sequence is that different researchers use different methods and a range of eye trackers, and there’s no standardized approach. In their paper, Gibaldi and Sabatini address this by comparing several analysis methods to figure out the most reliable, consistent procedure. They propose several recommendations, including fitting a model to the trajectory of the eye movement itself, and using a particular form of the function (shown below) to describe the shape of the main sequence.
These procedures not only offer a way to standardize measurement of the main sequence, but allow researchers to measure it more quickly and easily. In the past, measurement of the main sequence has typically been limited to recordings from high-speed, research-grade eye trackers. In their paper, Gibaldi and Sabatini show that, in principle, the same analysis procedure could be used with many off-the-shelf, commercially-available eye trackers. In addition, these measurements also can be performed while participants freely view photographs, instead of requiring them to complete a specific task. Their fast and reliable procedures are particularly promising when it comes to measuring the main sequence with children and neurological populations.

A final element of their paper is that Gibaldi and Sabatini have developed a Matlab-based toolbox—called the Eye Movement Analysis (EMA) toolbox—that is freely available for researchers to use. This toolbox implements their analysis, but also can be used more generally to classify eye movement data into saccades and fixations, and plot the spatial distribution of fixations. Using an approach like the one described here might allow researchers to more easily compare eye movements between neurological populations and healthy controls. While the saccade main sequence might have little to do with astronomy, it has important research and clinical applications that are out of this world!
Featured Psychonomic Society article
Gibaldi, A., & Sabatini, S. P. (2021). The saccade main sequence revised: A fast and repeatable tool for oculomotor analysis. Behavior Research Methods, 53(1), 167-187. https://doi.org/10.3758/s13428-020-01388-2

