One of the major head-scratchers that keep researchers of many disciplines awake at night is the concern about reproducibility of past experimental findings. As it emerges, only a fraction of existing experimental studies, when replicated with the same methodology and conducting the same analyses, returned results that are comparable to the original ones. This replication crisis has mostly involved the social and medical sciences for about a decade.
The blame for this crisis has often been put on inaccuracies and errors during statistical analyses. As scientists, we build statistical models to test specific hypotheses about experimental or real-world data. Ideally, we don’t want our model to falsely detect a statistically significant effect that is in fact not present in a population (type I error or false positive). As well, we don’t want our study to lack power and fail to detect a significant effect that is actually there (type II error or false negative).
What steps can scientists take to avoid incurring these errors and thus guarantee more replicable results?
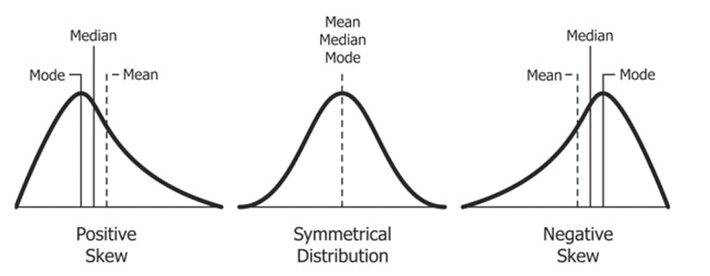
The evidence we collect through experiments or real-world observations comes in a variety of forms and distributions. A good deal of phenomena in the world that surrounds us (e.g., height, blood pressure, roll of fair dice) are described by the normal, or Gaussian, distribution (see figure below). The Gaussian distribution holds a special place in the heart of every researcher. Here, values cluster around the mean and decrease symmetrically as we move away from it.

But Gaussian distributions cannot account for all phenomena. Other variables might taper off differently on one tail of the distribution (see figure above). Fixation durations in eye movement research, for instance, frequently have a positive skew, with a large number of short fixations and a long tail of longer fixations. By contrast, human longevity is usually negatively skewed, with most people living until old age, and a long tail of people dying at younger ages.
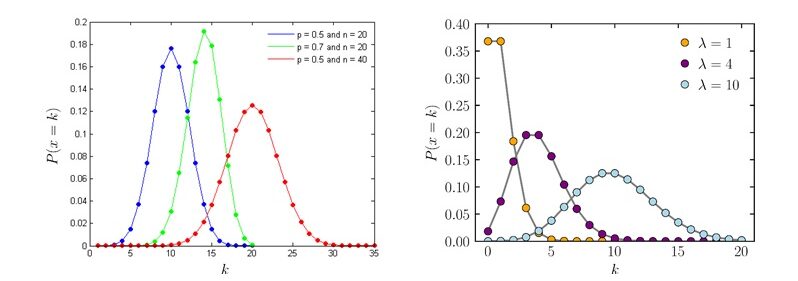
Another case is with yes-no data, such as the probability that online users will click on a given ad or not. These data are modeled by a binomial distribution (see figure below left). By contrast, a Poisson distribution (see figure below right) can model the probability of discrete events happening at a fixed rate in a given time or space, such as the number of spelling mistakes made while typing text.

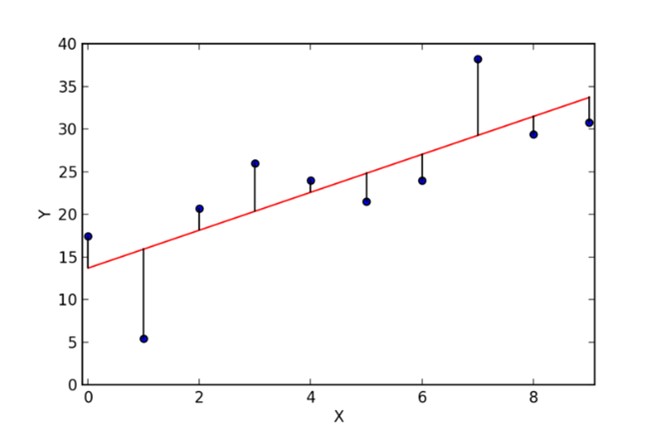
Most commonly, behavioral and social scientists fit linear models to data. Linear models describe the relationship between a response variable Y (e.g., how long readers fixate on a specific word) and a predictor variable X (e.g., how frequent that word is in language use) by fitting a line to observed data (see figure below).

Crucially, a set of assumptions need to be met to meaningfully interpret the estimates of linear models. One assumption is that the errors of the model (i.e., the differences between observed and predicted values) are normally distributed (normality assumption).
While recent advances in statistical modeling have made it possible to fit generalized linear (mixed) models (GLMMs) when errors are not normally distributed (e.g., binomial, Poisson, etc.). Researchers should nonetheless be cautious about other distributional assumptions. For instance, a Poisson regression would require the occurrences of events to be independent from one another and not too spread out from the mean (i.e., overdispersed).
In a recent article published in the Psychonomic Society journal Behavior Research Methods, researchers Ulrich Knief and Wolfgang Forstmeier (pictured below) made the case that, even when dealing with non-normal data, Gaussian models still represent the safest option against inflated type I error rates and unreliable parameter estimation.

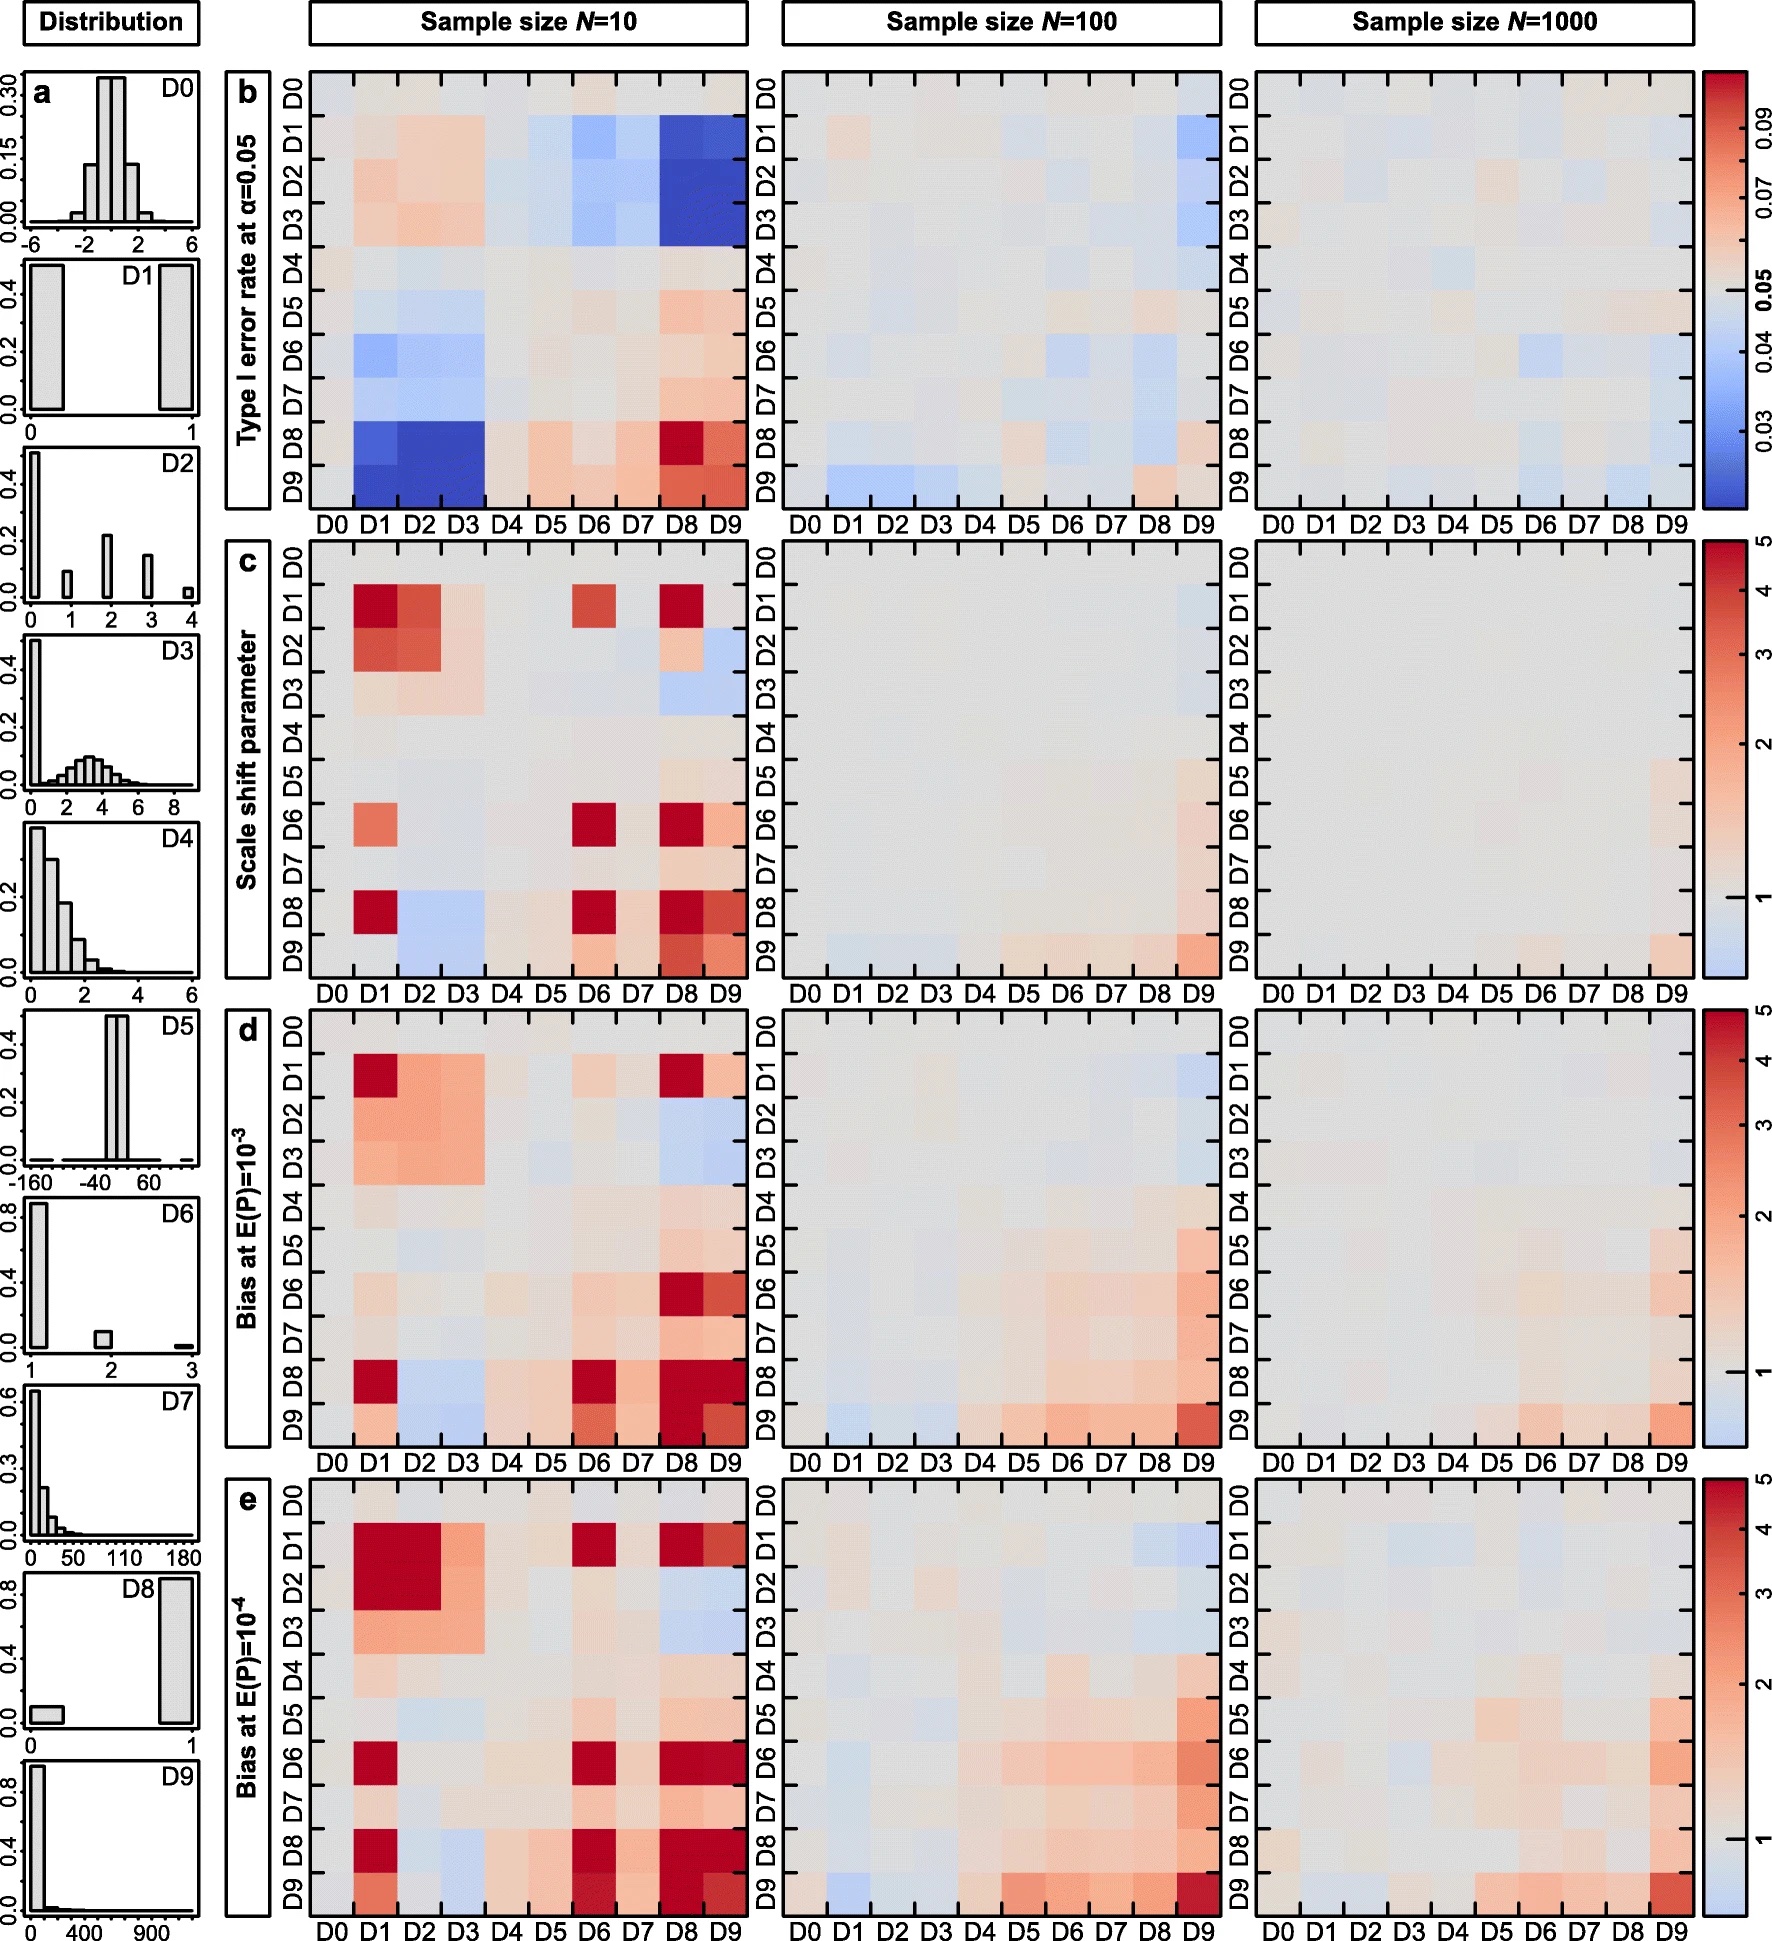
To make their point, the authors carried out a series of Monte Carlo simulations by testing the robustness of linear models on 10 different distributions, applied to both predictors and dependent variables. These distributions (D0-D9, see figures below) are ordered according to their tendency to produce outliers (i.e., extreme observations that strongly diverge from the rest of data points), with D0 being a Gaussian distribution.
The 10 distributions were applied to both the predictor X and the dependent variable Y in every possible combination, resulting in a total of 100 different settings. Each combination was in turn applied to samples of three different sizes (10, 100, and 1000). For each combination of the dependent and predictor variable, the authors fitted a linear model to 50,000 datasets.
The R code for generating these model combinations and testing their statistical robustness is contained in the R package “TrustGauss,” made available by the authors through the Open Science Framework.
All the models generated were evaluated on a series of measures (see next two figures below), including:
- rates of type I errors
- the scale shift parameter reporting how the observed and expected distributions of p values matched across the entire range of p values
- the deviation (bias) of p values at expected p values of 10-3 and 10-4
- statistical power, i.e., the likelihood of detecting an effect when in fact there is one
- bias and precision of the regression coefficient b, corresponding to its mean and coefficient of variation (a measure of dispersion)


Generally speaking, the models remained robust even when the normality assumption was violated. Sample size and the presence of outliers, rather than distribution type, were the greatest determinants of type I error rates, power and bias, and precision of parameter estimates. Specifically, larger sample sizes (100 and 1000) and a lower presence of outliers (as in distributions D0-D7) led to more reliable hypothesis testing and parameter estimation.
Despite the robustness of Gaussian models against even dramatic violations of the normality assumption, authors still warned researchers not to be caught off guard by other violations of model assumptions, which could still lead to inflated type I error rates. For example, observations need to be independent, while the variance of model errors should be constant for every value of the predictor variable (homoscedasticity). In the case of Poisson regressions fitted on count data, experimenters should watch out for overdispersion, which happens when variance is higher than the mean. Overdispersion could be present, for instance, in counts referring to discrete natural entities (e.g., number of animals living in an area, number of shooting stars appearing in a specific part of the sky) or concentrations (e.g., number of molecules).
To sum up, researchers might often be confronted with the question of which model is safest to choose when dealing with non-normal data.
The answer suggested by Knief and Forstmeier’s simulations couldn’t be clearer. When in doubt, keep it Gaussian.
According to the authors,
We here show that Gaussian models are remarkably robust to even dramatic violations of the normality assumption and that it may often be “the lesser of two evils” when researchers fit conventional Gaussian (mixed) models to non-normal data. We argue that for the key purpose of limiting type I errors it may often be fully legitimate to model binomial or count data in Gaussian models. We also highlight that Poisson models often lead to high rates of false-positive conclusions when the distributional assumptions are not met (i.e. the data are overdispersed).
Featured Psychonomic Society Article
Knief, U., & Forstmeier, W. (2021). Violating the normality assumption may be the lesser of two evils. Behavior Research Methods, 53(6), 2576-2590. https://doi.org/10.3758/s13428-021-01587-5
