Even beautiful minds take time to develop and mature. There is evidence that even an alleged child prodigy such as Wolfgang Amadeus Mozart, who started composing at age 5, required 10 years of practice to produce an outstanding piece of creativity. Alas, even beautiful minds will eventually turn from productivity to retirement, and no matter how great the genius, all composers stop producing outstanding output later in life (unless the grim reaper interferes with that standard trajectory).
There are, however, differences in this developmental trajectory of creativity and performance. Dean Keith Simonton, one of the leaders in this field, provides the following graph of lifetime productivity for three different groups of creative people:
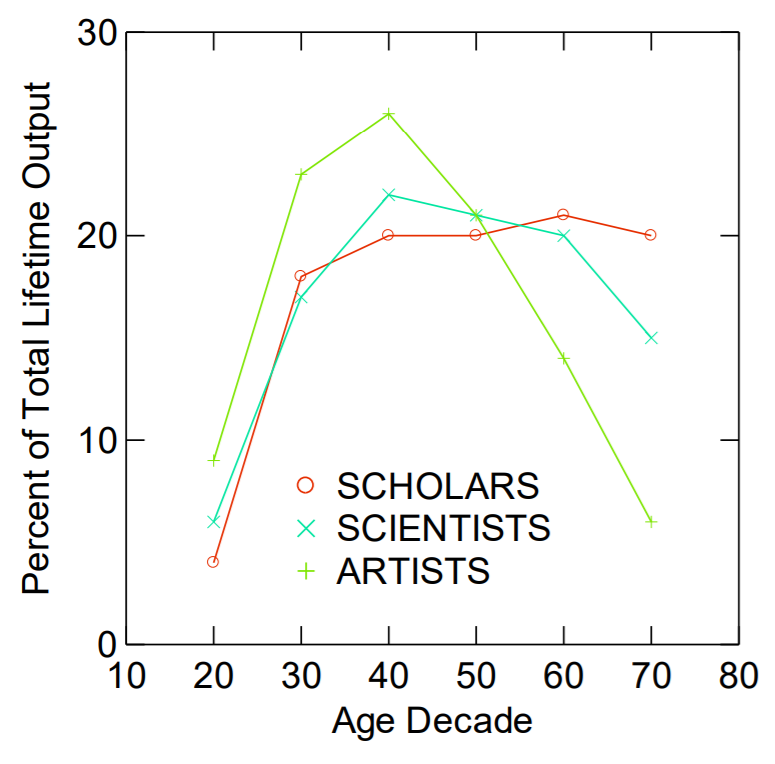 The figure permits several conclusions: First, it takes time to reach peak output. Second, unless one is a “scholar”, there is clear evidence of decline in output past middle age. Third, I am a scholar.
The age-related performance trajectory is of interest not only for intellectual pursuits. Physical pursuits also have an age-related trajectory, and that trajectory appears to be particularly condensed into a relatively short time span. There may be productive 70-year old scholars, but there are not too many 70-year old professional soccer players.
A recent article in the Psychonomic Society’s journal Behavior Research Methods examined the age-related performance trajectory of elite basketball players. Researchers Nemanja Vaci, Dijana Cocić, Bartosz Gula, and Merim Bilalić exploited the availability of a large data base spanning over five decades of performance of National Basketball Association (NBA) elite athletes. Vaci and colleagues were particularly interested in individual differences in the rates of development and deterioration.

From a purely physiological perspective, most of our lifespan is spent in a process of deterioration. Muscle strength and endurance, and the number of fibers in a muscle increase throughout childhood and reach a peak around the age of 25. From then on, our muscles age and deteriorate. The deterioration is slow initially, until we reach 50. After that, the decline is fairly rapid and inevitable. What is less clear is how those basic physiological processes map into skilled performance, and how individuals differ on those indicators.
Vaci and colleagues examined three well-understood performance indicators: win shares (WS), value over replacement player (VORP), and player efficiency rating (PER). In a nutshell, WS estimates a player’s contribution to the teams’ wins. VORP similarly seeks to measure a player’s contribution to the team, although it relies more on offense-related statistics than WS. Finally, PER measures the productivity and efficiency of a player during his time on the court. In case you are wondering, this is the formula for computing PER (before adjustment):
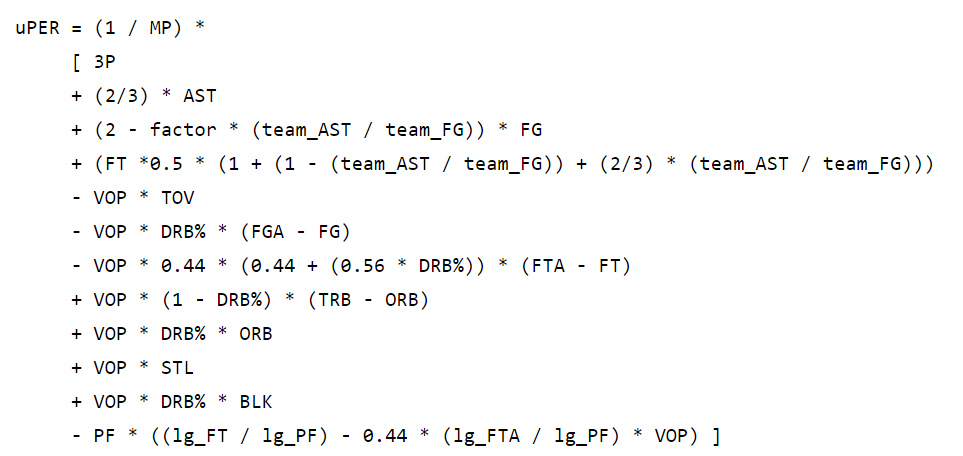
It appears as though basketball is merely a branch of measurement theory.
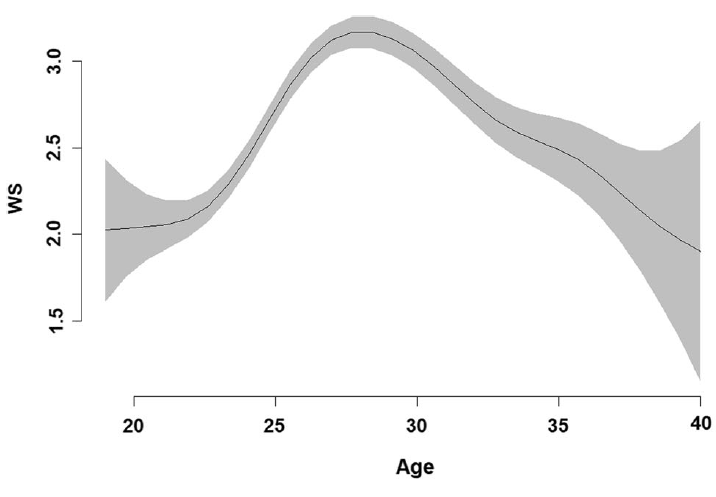
The figure below shows the WS scores as a function of players’ age, based on 50 years of data for 2,845 players. It is clear that players peak in their late 20s and that their performance declines quite rapidly after that. By the time players reach 40, their average performance is worse than it was 20 years earlier, at the outset of their career. Notably, however, there is considerable variability around that mean estimate of performance.
The next figure breaks down this overall relationship according to how much time a player spent on court during his entire career. This “heatmap” represents high performance in red and poor performance in light beige. It is clear that time-on-court is an important variable that moderates the inverted-U shape observed in the earlier figure. Players who do not spend much time on court do not get better in their late twenties—but they also do not decline later in life (presumably because there is not much room to move towards the floor).
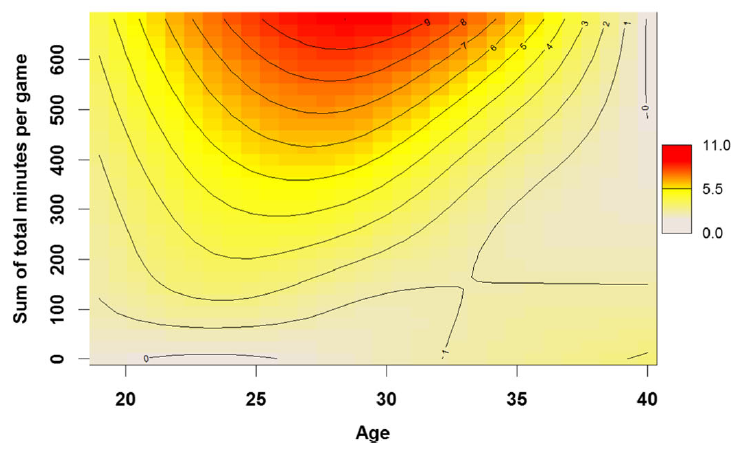
This heat map is representative of a set of variables that Vaci and colleagues entered into a statistical model to explain the individual differences in performance acquisition and subsequent decline. At the heart of their model were two latent factors that represented the skill acquisition and aging periods, respectively. Latent variables are not directly measured but are inferred from the data. Although at first glance this may suggest that latent variables are somehow “fuzzier” than quantities that we can actually measure, in fact the reverse is true: latent variables can be free of measurement error and hence they provide a particularly powerful tool to infer the association between constructs, such as working memory capacity and fluid intelligence.
In this instance, Vaci and colleagues were particularly interested in the potential association between the speed of development (how fast a player improved towards peak performance) and the speed of aging (how fast players deteriorated). The results are shown in the figure below, based on a sample of 400 randomly-chosen players. Each dot represents an individual’s score on the two factors:
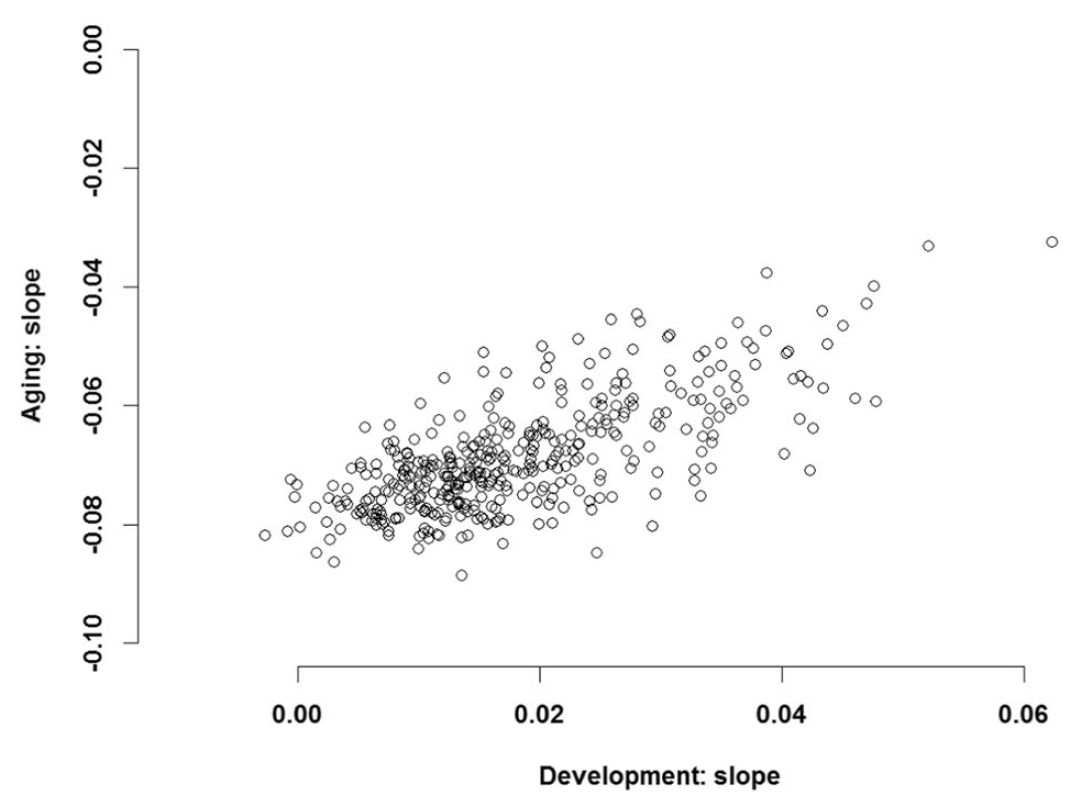
It is important to recognize that the Y-axis has the zero point at the top, and all values further down the axis are (increasingly) negative numbers. Negative numbers denote the negative slope of performance as a function of age past the point of maximal performance in a player’s late 20s. Thus a point in the bottom left corresponds to slow learning and fast deterioration, whereas a point towards the top-right corresponds to fast learning followed by slow deterioration.
In a nutshell, star players whose early career development was particularly fast were protected against fast deterioration later in their careers. One of the reasons this might be so was articulated by the first author, Nemanja Vaci:
“… once the decline in physical performance begins, more knowledgeable or more able players may utilize knowledge from earlier in their career to help effectively preserve their performance while ageing.”
It remains to be seen if the same applies to academics: Perhaps having an h-index of 20 at the end of your first post-doc offers protection against late-career performance decline. But then again, if you are a scholar, then perhaps you don’t have to worry about a decline.
Psychonomics article focused on in this post:
Vaci, N., Cocić, D., Gula, B. & Bilalić, M. (2019). Large Data and Bayesian Modeling – Aging Curves of NBA Players. Behavior Research Methods, DOI: 10.3758/s13428-018-1183-8.

